Jira is a powerful project management tool that offers various features to track and manage releases efficiently. In this blog post, we will explore two essential reports in Jira: The Version Report and the Release Burndown Report. These reports provide valuable insights into the progress of your releases and help you ensure timely delivery. However, it’s important to note that these reports are only available for company-managed projects in Jira. If you’re using a team-managed project, you may need to export the data and create similar charts manually. Let’s dive into these reports and discover how they can assist you in effectively managing your releases.
The Version Report
To access the Version Report in Jira, click on “Reports” in the left panel, and you’ll find it listed below. Here’s what you’ll see:
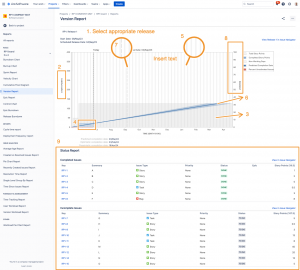
- Select the appropriate release: Ensure that you have chosen the correct release, which is displayed in the top left corner. If you have multiple releases, you can select the desired one from the dropdown menu.
- Overview of the report: The Version Report presents a graph depicting the completed Story Points over time. The vertical axis represents Story Points, while the horizontal axis represents time.
- Total Story Points: The light gray area on the graph represents the total number of Story Points in the release. It reflects the summation of all the Story Points assigned to Product Backlog Items that are to be included in the release.
- Completed Story Points: The blue area on the graph indicates the Story Points that have been completed. It represents the work done by your team.
- Non-working days: Weekends and other non-working days are represented as gray areas on the graph.
- Predicted completion date: The blue line on the graph predicts the potential completion date of the release based on your team’s average daily Velocity. By hovering over the dot on the line, you can view the specific completion date. Additionally, the report also provides an optimistic and pessimistic date range to account for possible variations in Velocity. The optimistic date is calculated by adding 10% to the daily average Velocity, and the pessimistic date is calculated by decreasing the daily average Velocity by 10%.
- Scheduled release date: The dotted line represents the release date you have set for the release. Comparing this date with the predicted completion date can help you identify any deviations from the planned schedule.
- Percent of unestimated issues: This information highlights the percentage of unestimated issues in your Product Backlog. Unestimated issues can skew the accuracy of the reports. It’s crucial to ensure that all items are properly estimated to obtain reliable insights. The percent of unestimated issues is indicated as a red line, and values given on the vertical axis to the right.
- Status report: The report concludes with a section displaying completed issues and a list of incomplete issues, along with the corresponding Story Points.
If you prefer, please watch our video on The Version Report.
The Release Burndown
Similar to the Version Report, the Release Burndown is accessed through the “Reports” section in Jira. Here’s what you can observe in this report:
- Story Points Progress: The report displays a bar chart where each bar represents a Sprint. It provides information on:
- Work remaining (Light blue section): Shows the total number of Story Points (based on the summation of Product Backlog Items originally assigned to the Release) remaining at the beginning of each Sprint.
- Work completed (Light green section): Indicates the number of Story Points completed during each Sprint.
- Work forecast (Bars with grey sections): If you have at least three Sprints, the report will estimate the number of Sprints remaining based on the average points completed over the last three Sprints.
- Work added (Dark blue section): If new Product Backlog items are added to the Release during a Sprint, they are shown as darker blue bars at the bottom of the chart.
- Sprint Details: By clicking on a specific bar, you can access more detailed information about that Sprint, including dates of the Sprint, and changes to the number of Story Points within the Release such as: remaining removed, and completed Story Points.
- Issue Status: Below the chart, you can find a breakdown of completed work and a list of remaining issues, providing a clear picture of the tasks accomplished and those yet to be completed.
Watch this video as we talk about the The Release Burndown.
The Version Report and the Release Burndown are two powerful reports in Jira that enable you to track and manage releases effectively. By leveraging these reports, you can gain insights into the progress of your releases, identify potential issues, and make informed decisions to keep your projects on track. Remember to select the correct release, address unestimated issues, and analyze the data in conjunction with stakeholder expectations. With these reports at your disposal, you can enhance transparency, facilitate communication, and ensure successful releases in Jira.


